


Executives of publicly traded shipping and offshore drilling companies have a legal duty to act in the interest of the shareholders of their respective organizations.
To fulfill this duty, executives and their financial managers must identify and undertake honest and ethical investment opportunities that offer a greater investment return than shareholders would otherwise be able to make in the open financial markets for the same level of risk.
To put it bluntly, if company management doesn’t produce enough growth for investors, the investors may decide to entrust their money elsewhere and the company’s stock price will fall.
Revenue Efficiency:
Companies can also create revenue growth by maximizing the efficiency and productivity within their existing fleets, but I’ll save that topic for another time.
When it comes to creating growth within shipping and offshore drilling companies, financial managers typically have two options. They can either build a new vessel or acquire an existing vessel from another company.
This article looks at the financial analysis used by drilling companies when determining whether or not it makes sense “financially” to build a brand new drilling rig.
For our case study, we’ll need to consider estimated construction costs, operating expenses and revenues of a state-of-the-art $800 million 6th generation drillship. We’ll also assume the ship will have a service life of 20 years.
The Opportunity Cost of Capital:
The first step in our decision of whether or not to build a new ship is to consider the “opportunity cost of capital“.
We’re all familiar with the expression “a dollar today is worth more than a dollar tomorrow”. If you had the choice of $10,000 today or $10,000 a year from now, which option would you rather have?
If you’re like most people you’d probably opt for $10,000 today. If for no other reason, you could put the money in a bank account and earn interest on it for the year.
The opportunity cost of capital is a business term that places a value on exactly how much more a dollar is worth today vs. a dollar a year from now (expressed as a percentage). In the example above, we chose to collect the $10,000 today vs. waiting a year to collect it.
Had we instead waited a year to collect the same $10,000 we would have lost out on the interest of investing that money in bank savings account. If the bank was paying 2% interest, that 2% represents our opportunity cost of capital.
In other words, it cost us 2% of our capital (the $10,000 that was owed to us) deciding to wait a whole year to get paid.
The concept of the “opportunity cost of capital” helps financial managers analyze investment options and cashflows on an “apples to apples” basis vs. comparing money received in one time period to money received in another time period. As you’ll see in a bit, we’ll use this principle when determining the economic viability of our hypothetical drillship project.
In this particular case, we’ll assume that the opportunity cost of capital for building a new drillship is 10%. In other words, the shipping company is expecting to earn at least a 10% return on their investment in a new drillship or else they may as well invest the money in stocks and bonds of similar risk to save the hassle of managing a shipyard project.
Understanding “Net Present Value”
With our opportunity cost of capital determined, we can then “discount” all projected future cashflows (revenue minus expenses) to find the value in today’s dollars of what our drillship investment will “earn” us in the future. The value of the project in “today’s” dollars is also called the “Net Present Value” or “NPV” of the investment.
For example, lets say the opportunity cost of capital for the $10,000 we talked about above was 10% and we wouldn’t receive the $10,000 until the end of 5 years. How much is $10,000 at 10% interest 5 years down the road worth today? To calculated this we simply divide the “principle”, which in this case is the $10,000, by (1.10)^5.
NPV Formula:
NPV=cashflow/1+(opportunity cost of capital)^years until cash flow is received
Where:
$10,000 is the payment
1.1 is 1 + the opportunity cost of capital expressed as a decimal
^ is the expression “to the power of” (in this case 1.1 multiplied by itself 5 times)
5 is the number of years until you receive the payment or “cashflow”
$10,000 is the payment
1.1 is 1 + the opportunity cost of capital expressed as a decimal
^ is the expression “to the power of” (in this case 1.1 multiplied by itself 5 times)
5 is the number of years until you receive the payment or “cashflow”
In this simple example, $10,000 at 10% opportunity cost of capital paid 5 years from now is “only” worth $6,209.
Getting back to our drillship example, to calculate the “Net Present Value” of our project, we need to estimate the annual (sometimes called “incremental”) cashflows for each of the 20 years the ship is in operation and then “convert” these cashflows to today’s dollars using the NPV formula we used in the example above.
Remember, we had to cough up $800 million to build our drillship, so the goal here is for the “net present value” of all future cashflow from operating the ship to be greater than $800 million. If the “net present” value of our ship building project is negative (including the cost of the ship) then we are better off foregoing the project and investing the $800 million in something else.
Hopefully I haven’t confused you too badly up to this point, but don’t worry if I have! To bring the whole picture together, I’ve created some simple spreadsheets in Excel (below) to help illustrate the entire process.
Projected Expenses:
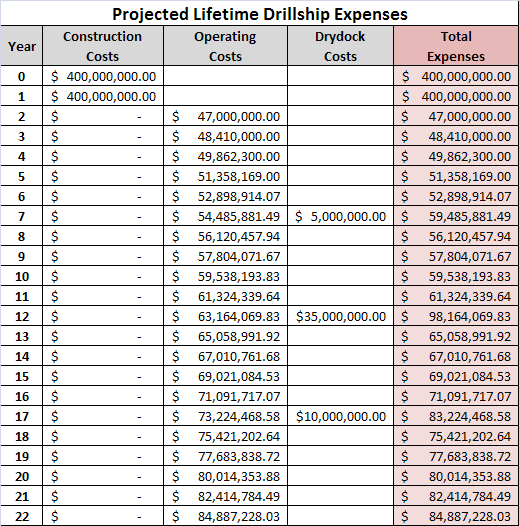
Now that the drilling company has agreed on an appropriate “opportunity cost of capital”, the company must consider the projected expenses of operating the drillship over its 20 year service life. To keep things relatively simple, I have broken these costs down into 3 categories:
Construction Costs: Let’s assume that the drilling company is paying cash for the construction of the new drillship with $400 million being paid at the start of the project and the remaining $400 million paid at the beginning of the next year (we’ll assume a two-year construction period).
Operating Costs: As you can probably imagine, the yearly operating costs for a 6th generation drillship can add up quickly. Between crew salaries, general maintenance, repairs, - “support” staff, consumables and other daily operating expenses, drilling companies spend tens of millions a year operating each one of their drilling units.
In this example, I have estimated operating costs to be $47 million the first year the vessel is in operation. I have also decided to increased these operating costs 3% each year to take into account inflation.
Drydock Costs: Whether or not the shipping company will be able to get their new drillship into a dry dock or not is another question, but regardless, money will need to be budgeted for major service upgrades every 5 years. In this particular example, I decided to include a $5 million upgrade at the 5 year mark, $35 million upgrade during the 10th year dry dock service, and $10 million upgrade at the 15 year mark to keep the vessel among the most capable in the industry.
The following Excel sheet captures these costs:
Projected Revenue:
The market for 5th and 6th generation rigs is still very strong and new-build 6th generation drillships are still commanding $500,000 day rates. Hypothetically, lets assume that our fictitious drilling company scored a 10 year contract at $500,000 per day.
Let’s also assume that the drilling company could operate the vessel with a revenue efficiency of 93% (less than 7% downtime). This would result in projected annual revenues of $169,725,000 for the first 10 years.
Let’s also consider that the vessel will score a 10 year contract extension (at the end of the current contract) only this time at $657,500 per day. At the same revenue efficiency of 93% this will amount to a projected annual revenue stream of $223,200,000 per year (for the final ten years of the vessel’s “life”).
The projected revenue over the “life” of our fictitious drillship is included in the table below. I have also included the “cashflow” from each year which is simply the revenues from that particular year minus the yearly operating expenses from the Excel sheet above:
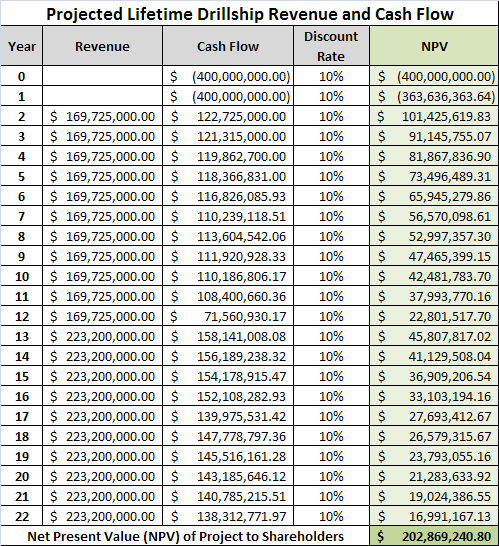
Using the NPV formula I mentioned above, I programmed the Excel sheet to calculate the NPV of the estimated cashflows for each year of the ship’s projected life. This NPV is the “converted” value of the cashflows in “today’s dollars”. As you’ll see in the total at the bottom of the spreadsheet, the value of the opportunity to invest in the new drillship is over $200 million dollars!
In other words, the investment in building the new drillship (based on our very basic assumptions) is worth $200 million more to shareholders over and above the “opportunity cost of capital”. That is the growth and value shareholders are looking for.
Although our example drillship, contract, and expense and revenue projections are all fictitious, the principles remain the same. The promise of “riches” is why we’ve seen virtually every drilling company in the world expand the size of their ultra-deepwater drilling fleets with aggressive new-build programs.
We’ve even seen companies with virtually no connection to the oil and gas industry commission new-build drillships on “spec”.
Demand is still strong for these vessels but as more and more are built on “speculation” and enter the market, day rates will inevitably come down and the promise of “huge” investment returns (like those we just calculated) will likely disappear.
@
Tagged @ maritime news


0 komentar:
Post a Comment - Kembali ke Konten